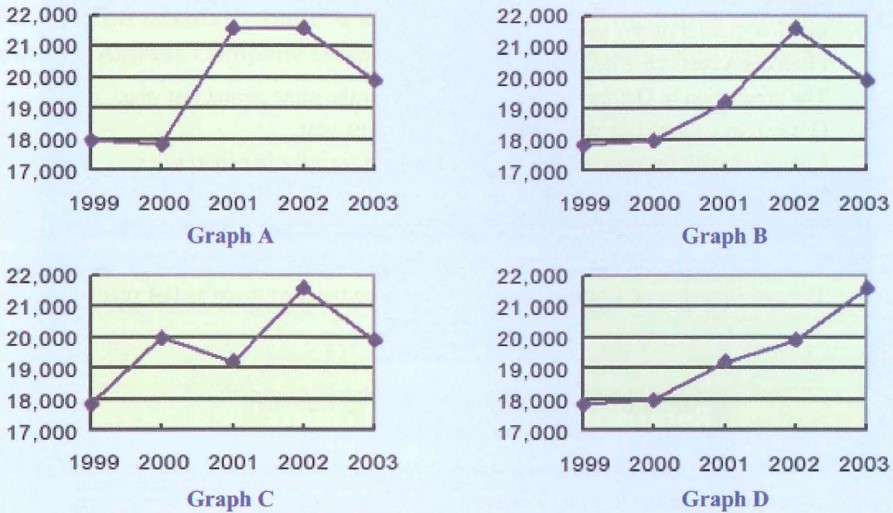
Listen to an automobile Sales Manager describing the sales performance of the Jeep V6. Fill in the blanks with what you hear, and decide which of the above graphs the manager is referring to.

- Sales ____ through 2000.
- In 2001, sales ____ steadily.
- In 2002, sales of the Jeep V6 ____ dramatically. At the end of that year, sales ____ of 21,600.
- In 2003, gas prices were ____ and sales were ____, and the sales figures ____ by 1,700 to 19,900.
The manager is referring to Graph ____.
