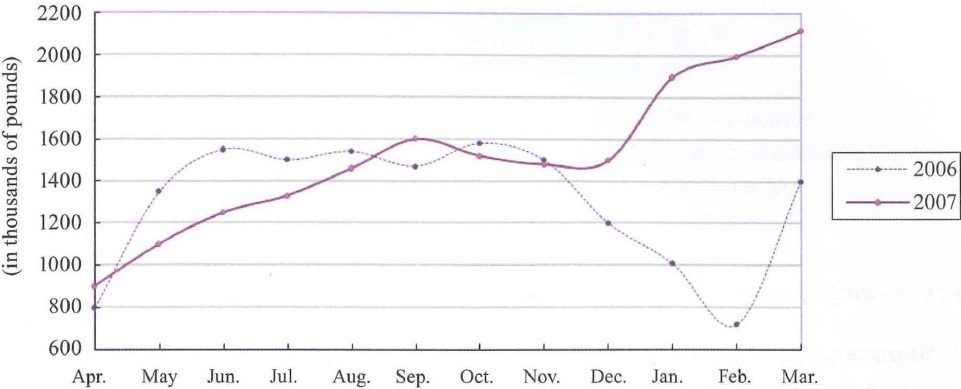
Work in pairs. Here is a line graph for the sales performance of a shoe company in financial years 2006 and 2007. Study the graph and describe it.
Sports Shoes Sales